Fibonacci
The Fibonacci number series and the properties of this series were made famous by the Italian mathematician Leonardo de Pisa. The Fibonacci number series starts with 0 and 1 and goes out to infinity, with the next number in the series being derived by adding the prior two. For example, 55 + 89 = 144, 89 + 144 = 233, 144 + 233 = 377, and so on (see the following number series):
0, 1, 1, 2, 3, 5, 8, 13, 21, 34, 55, 89, 144, 233, 377, 610, 987 . . . out to infinity
What is most fascinating about this number series is that there is a constant found within the series as it progresses toward infinity. In the relationship between the numbers in the series, you will find that the ratio is 1.618, or what is called the Golden Ratio, Golden Mean, or Golden or Divine Proportion. (For example, 55 x 1.618 = 89, and 144 is 1.618 times 89.)
Take any two consecutive numbers in the series after you get beyond the first few and you will find the Golden Ratio. Also note that the inverse or reciprocal of 1.618 is 0.618.
We will not use the Fibonacci number series to analyze the markets. Instead, we will use the ratios derived from this number series.
We’ve already discussed 1.618 and 0.618 or the Golden Ratio and its inverse.
The main ratios I use in my everyday analysis are 0.382, 0.50, 0.618, 0.786, 1.00, 1.272, and 1.618.
We will sometimes also include 0.236, 2.618, and 4.236. You saw how we found the 0.618 and 1.618 ratios within the Fibonacci number series, but what about the rest of these ratios? Well, actually, they are all related mathematically.
For example:
1.0 - 0.618 = 0.382
0.618 x 0.618 = 0.382
1.0 / 2 = 0.50
Square root of 0.618 = 0.786
0.618 is the reciprocal of 1.618
Square root of 1.618 = 1.272
0.618 - 0.382 = 0.236
0.382 x 0.618 = 0.236
1.618 x 1.618 = 2.618
2.618 x 1.618 = 4.236
FIBONACCI RETRACEMENT
Fibonacci retracement is created by taking two extreme points (usually a major peak and trough) on a stock chart and dividing the vertical distance by the key Fibonacci ratios of 23.6%, 38.2%, 50%, 61.8% and 100%. Once these levels are identified, horizontal lines are drawn and used to identify possible support and resistance levels.
FIBONACCI EXTENSION
Fibonacci Extensions are used to forecast future levels of support and resistance as well as Targets and are drawn beyond the typically used 100% level. 161.8%, 261.8% and 423.6% are the most commonly used Fibonacci extension levels.
FIBONACCI CLUSTER
Confluence of multiple Fibonacci projections of different/same timeframe had correctly predicted strong resistance /Support Levels
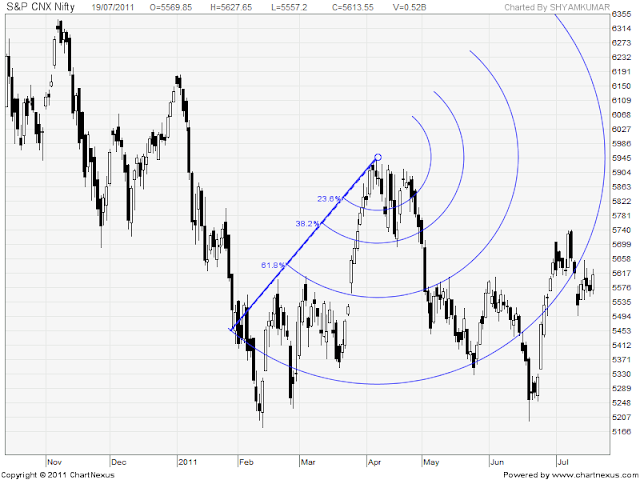
FIBONACCI ARCS
Fibonacci Arcs are created on a chart by first drawing a trendline between two extreme points, a trough and opposing peak. Three arcs are generated that are centered on the second extreme point and intersect the trendline at Fibonacci Levels, usually of 38.2%, 50% and 61.8% of the distance between a price maximum and minimum. The interpretation of Fibonacci Arcs involves looking for support and resistance as prices approach the arcs. Fibonacci Arcs and Fibonacci Fan Lines are sometimes used together to anticipate support and resistance at the points where the Fibonacci studies intersect.
FIBONACCI FAN
Fibonacci Fan is displayed by first drawing a trendline between two extreme points, a high and low. An invisible vertical line is drawn through the second extreme point. Three lines are then drawn from the first extreme point (the leftmost point) passing through the invisible vertical line with their slopes at the Fibonacci levels, usually 38.2%, 50.0% and 61.8%. These lines indicate areas of support and resistance.


No comments:
Post a Comment