Sep 3, 2011

Elliot Wave Learning Center


Elliott Wave Principle is an exercise in probability. An Elliottician is someone who is able to identify the markets structure and anticipate the most likely next move based on our position within those structures. By knowing the wave patterns, you’ll know what the markets are likely to do next and (sometimes most importantly) what they will not do next. By using the Elliott Wave Principle, you identify the highest probable moves with the least risk.
(www.elliottwave.com)


For  learning  ,elliott wave content are arranged as below


1. Elliott Wave Basic Part1
2.Elliott Wave Analysis of Bank Nifty


Elliot Wave Analysis for Bank Nifty


Elliot Wave Basic -Part1


Five-Wave Impulse Trend: 
Made in the direction of the higher time frame trend direction. 
1. 5 Distinct Sections
2. Higher highs and higher lows (bull trend) or lower highs and lower lows (bear trend).
3. Section Highs and Lows do not overlap


Simple three-wave or three Section ABC Counter Trend (correction)
1. If Section Highs and Lows overlap, it should not be an impulse trend and 
should be a counter-trend. 
2. The most typical counter-trend is three sections which make up a simple ABC 
correction. 


Complex Counter Trend
1. More Than 3 Distinct Sections
2. Multiple Sections Overlap
3. It is very difficult to project the completion of a complex counter trend.
4. The most important thing is to recognize it is a counter-trend and not an impulse trend. 


Important of Identifying the Position of a Market Within A Trend or CounterTrend


1. Helps determine which side of the market to trade. If a trend or counter trend is 
not complete, you trade the side that the trend or counter trend is moving.


2. Helps identify if the patterns signal that a trend is complete. If the pattern is in 
a position to be complete, it will be an early warning of a reversal and you will
trade the other side of the market. 


Sep 2, 2011

Nifty Weekend Analysis-3rdsep2011

If price continue to stay above 5000 then this up move will sustain till the 5165-5200 .Selling can be done around  5165-5200 with stop loss of 5225.


Sep 1, 2011

Nifty Analysis And Bank Nifty Analysis For 2ndSep2011


Nifty Conservative Trading
--------------------------------
Nifty Monthly Long above 5705(HEMA) and 5167 (LEMA) (TREND UP ABOVE 5399)
Nifty Weekly Long above 5162(HEMA) and 4908(LEMA) (TREND UP ABOVE 5016)
Nifty Daily Long above 4960(HEMA) and 4851 (LEMA) (TREND UP ABOVE 4915)
Nifty Hourly Long above 4909(HEMA) and 4877 (LEMA) (TREND UP ABOVE 4900)


Nifty JNSAR
---------------------------------------
Nifty Weekly JNSAR 5174 -stay short
Nifty Daily JNSAR 4942 -stay long
Nifty Hourly JNSAR 4877 -stay long


Nifty Havala Level
-----------------------------------------------
30-July-11 4840


Nifty Aggressive Trading
---------------------------------
Range 56 max 5075 min 4980
STOP LOSS 10 points only.


Support and Resistance
--------------------
4680-4784-4810-4865-4951-(5006-5011)-5057-5114-5182-5225-5296-5350-5393-(5433-5460)-5490-5502-5532-5539-5550-5580-5606-5616-5630-5658-5667-5729-5754-5775-5865-(5940-5965)-6090-6175-6250-(6325-6350)


Open Interest 
-----------------------
Support 4700/4800
Resistance 5000


Trade Conclusion
--------------------------------
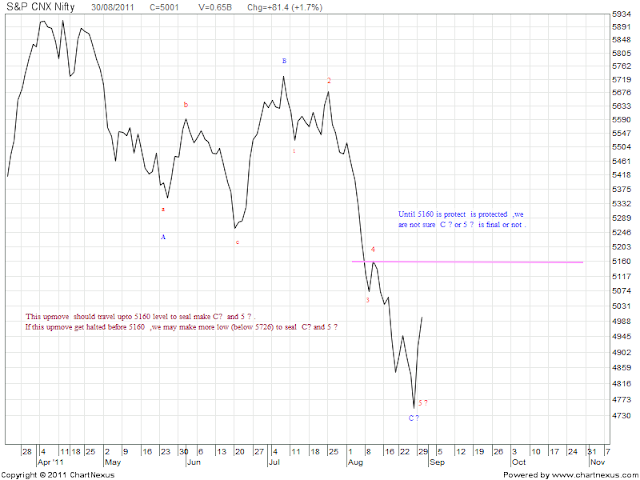
Daily and Weekly chart have shown bullish reversal. Go Long ..............
This upmove may face resistance at 5060.


We may move upto 5165.if this upmove is halted before 5160 , we may turn down to make new low below 5726.
Selling can be done 5165-5200 level for target below 5726.


Hope that helps .Take care .Have a happy trading.
Bank Nifty Analysis on http://tradeinbankonly.blogspot.com


Trends and Counter Trend

Five-Wave Impulse Trend: 
Made in the direction of the higher time frame trend direction. 
1. 5 Distinct Sections
2. Higher highs and higher lows (bull trend) or lower highs and lower lows (bear trend).
3. Section Highs and Lows do not overlap


Simple three-wave or three Section ABC Counter Trend (correction)
1. If Section Highs and Lows overlap, it should not be an impulse trend and 
should be a counter-trend. 
2. The most typical counter-trend is three sections which make up a simple ABC 
correction. 


Complex Counter Trend
1. More Than 3 Distinct Sections
2. Multiple Sections Overlap
3. It is very difficult to project the completion of a complex counter trend.
4. The most important thing is to recognize it is a counter-trend and not an impulse trend. 


Important of Identifying the Position of a Market Within A Trend or CounterTrend.
1. Helps determine which side of the market to trade. If a trend or counter trend is 
not complete, you trade the side that the trend or counter trend is moving.

2. Helps identify if the patterns signal that a trend is complete. If the pattern is in 
a position to be complete, it will be an early warning of a reversal and you will
trade the other side of the market. 


Fibonacci Learning Center


Fibonacci trading has long existed and is a fairly accurate way to trade the markets.  It is often used in trading stocks, currencies and futures markets.Since the stock markets can be unpredictable, it’s important as traders to have a specific trading plan and rules. This will allow you to let the market move freely and allow you to stay disciplined to do the right thing every time.


People who are interested in the markets are always looking for new and better ways to analyze price so they can become more profitable. Fibonacci ratios and Fibonacci patterns is a great way to find areas where markets may look to find support or resistance and even at times find areas where they may reverse a trend.


As I do more research on Fibonacci trading strategies, I will keep updating Fibonacci Learning center. This is because Fibonacci ratios exist in all markets and all time frames. What’s key is that in order to use them effectively, you need to have a solid trading plan, a set of rules, and you have to be disciplined in executing your setup on every single trade.


List of important Fibonacci learning on our site
1. Basic of Fibonacci -Part1
2. Basic of Fibonacci -Part2
3. Using Fibonacci for Practical Trading 
4. Fibonacci Price Cluster and Symmetry
5. Minor retracement 0.382 is indication of strength
6. How to Draw Fibonacci Retracement
7. Fibonacci -SlingShot Trade
8. Fibonacci- Trend or Correction
9.Fibonacci Revision
10.Quick Fibonacci Revision
11.Gartley Trading Pattern-Ross beck


Aug 29, 2011

Nifty Analysis for 30thAugust2011

4965 and 5014 are  critical Level ,above  which 5165  will be on card.