One of the most important aspects of adhering to any particular trading strategy is to believe that the strategy is a high probability strategy. It is very hard to believe in a trade strategy if you don't know how it works (I.E. Black Boxes.) With this in mind, let's carefully consider each of the individual legs that unfold in the Gartley Pattern to understand the Psychology behind this high probability set up.
Referring to the first example “A” in figure 27 from H.M. Gartley’s book, Profits in the Stock Market, Gartley first identifies a bearish A-B leg . This leg appears to be a significant trend move or impulsive phase with minor rallies punctuating the down trend. At the completion of this A-B leg, we notice a significant rally that is labeled as the B-C leg. This B-C rally exceeds the previous rallies in the A-B downtrend in both price and time. This B-C price action indicates that the previous downward trend might be complete and that the B-C leg might be indicating the beginning as a new impulsive trend move in the opposite direction of the previous A-B move down. This B-C leg is very typical of what happens when traders all begin to cover their short positions after a sustained bearish trend. The B-C leg completes when the short covering is complete. With this in mind, the assumption is that the market will not take out the low at point B as a new trend up will probably continue higher and never look back. Based on this information,Gartley puts his protective sell stop just below point B.Though Gartley mentions the A-B leg in his book, most educators of the Gartley Pattern omit this important aspect of the pattern.

At the completion of the B-C move, Gartley mentions that there will be a minor decline that cancels a third to a half of the preceding minor advance (B-C). In other words, Gartley is looking for a 33% to 50% retracement of the B-C move up. Why does this minor decline take place? This minor decline could be caused by traders that were anxious to get short in the previous A-B decline. These bears were waiting for a significant pullback during this bearish trend down, however the market kept missing their sell limit orders on the rallies. Now that the market has had a significant rally against the downtrend, they start selling at point C and push the market down. Depending on where they get filled, they will put their stops just above point C. This selling from the “late bears” pushes the market down into what Gartley describes as a minor decline. This original Gartley Pattern ends up having a very different look and feel compared to how it is being taught today. The original Gartley Pattern was quite a simple pattern. Gartley did not discuss any Fibonacci ratios, Elliott Wave, etc. In Gartley’s bullish example, it would appear that all he is looking for is a significant rally off of a bottom, followed by a retracement of 33% to 50%.
At the completion of the B-C move, Gartley mentions that there will be a minor decline that cancels a third to a half of the preceding minor advance (B-C). In other words, Gartley is looking for a 33% to 50% retracement of the B-C move up. Why does this minor decline take place? This minor decline could be caused by traders that were anxious to get short in the previous A-B decline. These bears were waiting for a significant pullback during this bearish trend down, however the market kept missing their sell limit orders on the rallies. Now that the market has had a significant rally against the downtrend, they start selling at point C and push the market down. Depending on where they get filled, they will put their stops just above point C. This selling from the “late bears” pushes the market down into what Gartley describes as a minor decline. This original Gartley Pattern ends up having a very different look and feel compared to how it is being taught today. The original Gartley Pattern was quite a simple pattern. Gartley did not discuss any Fibonacci ratios, Elliott Wave, etc. In Gartley’s bullish example, it would appear that all he is looking for is a significant rally off of a bottom, followed by a retracement of 33% to 50%.


As you can see, the pattern above is a complex five point pattern that has to conform to specific Fibonacci ratios on each of it’s four legs. The main differences between the modern Gartley Pattern above and the original Gartley Pattern are…
1. The labels in the original pattern are A,B,C. The labels for the modern pattern are X,A,B,C,D.
2. The modern Gartley omits the original A-B leg.
3. The modern Gartley emphasizes the equality of the A-B leg and the C-D leg whereas the original does not.
4. The original Gartley pattern did not include any Fibonacci ratios.
5. The completion of the original pattern was at 33%-50% whereas the modern pattern completes at the 78.6% retracement of the XA move.
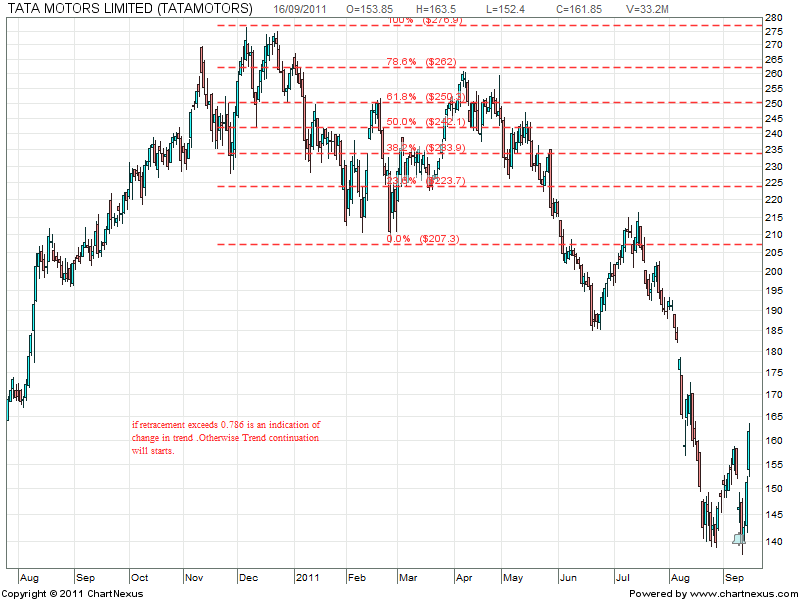
Larry Pesavento was the first person to apply Fibonacci ratio’s to the Gartley pattern. Larry observed that the Gartley pattern appeared to be a more reliable pattern if it completed at a 61.8% retracement or 78.6% retracement. Based on my 10+ years of experience with the Gartley pattern, it appears that if you have to choose between the two of these ratios, 78.6% seems to work the best. With my personal trading, I will only trade the 78.6% Gartley patterns. Why? I would rather trade less often and increase the chances of my wins on the few trades that I make. If you feel a need to trade more often, it may be time to take a personal inventory. We need patience to wait for good Gartley Patterns, remember Gartley himself said, “The art in conducting an operation of this kind lies in..Having the patience to wait …”. In addition, one of the added benefits of using the 78.6% retracement is its proximity to where our protective stop is located. Remember Gartley said,” In the other two cases, only small losses have to be taken”. So if we choose the 78.6% versus the 61.8% Fibonacci level to enter, our risk will be reduced if we use the location Gartley suggested for our stop. If we are wrong, we will risk less money with an entry at 78.6% versus 61.8%.
One of the other reasons that I prefer the 78.6% level is that the public is typically unaware of this level as it does not appear in the defaults of most Fibonacci retracement drawing tools. Therefore there is contrarian value in using this level. Also, by the time a market arrives at 78.6%, most of the typical 61.8% fib traders have been stopped out. At this point in time, there is a lot of uncertainty as traders watch for a bounce or a break based on their focus on the previous high or low. Also, typically there is an increase in the volatility in the 78.6% retracement area as the market begins to reflect the uncertainty of its participants. The volatility in this zone will help us if we enter with a multiple contract strategy that allows us to leverage the scale out of the market.
Referring to the first example “A” in figure 27 from H.M. Gartley’s book, Profits in the Stock Market, Gartley first identifies a bearish A-B leg . This leg appears to be a significant trend move or impulsive phase with minor rallies punctuating the down trend. At the completion of this A-B leg, we notice a significant rally that is labeled as the B-C leg. This B-C rally exceeds the previous rallies in the A-B downtrend in both price and time. This B-C price action indicates that the previous downward trend might be complete and that the B-C leg might be indicating the beginning as a new impulsive trend move in the opposite direction of the previous A-B move down. This B-C leg is very typical of what happens when traders all begin to cover their short positions after a sustained bearish trend. The B-C leg completes when the short covering is complete. With this in mind, the assumption is that the market will not take out the low at point B as a new trend up will probably continue higher and never look back. Based on this information,Gartley puts his protective sell stop just below point B.Though Gartley mentions the A-B leg in his book, most educators of the Gartley Pattern omit this important aspect of the pattern.

At the completion of the B-C move, Gartley mentions that there will be a minor decline that cancels a third to a half of the preceding minor advance (B-C). In other words, Gartley is looking for a 33% to 50% retracement of the B-C move up. Why does this minor decline take place? This minor decline could be caused by traders that were anxious to get short in the previous A-B decline. These bears were waiting for a significant pullback during this bearish trend down, however the market kept missing their sell limit orders on the rallies. Now that the market has had a significant rally against the downtrend, they start selling at point C and push the market down. Depending on where they get filled, they will put their stops just above point C. This selling from the “late bears” pushes the market down into what Gartley describes as a minor decline. This original Gartley Pattern ends up having a very different look and feel compared to how it is being taught today. The original Gartley Pattern was quite a simple pattern. Gartley did not discuss any Fibonacci ratios, Elliott Wave, etc. In Gartley’s bullish example, it would appear that all he is looking for is a significant rally off of a bottom, followed by a retracement of 33% to 50%.
At the completion of the B-C move, Gartley mentions that there will be a minor decline that cancels a third to a half of the preceding minor advance (B-C). In other words, Gartley is looking for a 33% to 50% retracement of the B-C move up. Why does this minor decline take place? This minor decline could be caused by traders that were anxious to get short in the previous A-B decline. These bears were waiting for a significant pullback during this bearish trend down, however the market kept missing their sell limit orders on the rallies. Now that the market has had a significant rally against the downtrend, they start selling at point C and push the market down. Depending on where they get filled, they will put their stops just above point C. This selling from the “late bears” pushes the market down into what Gartley describes as a minor decline. This original Gartley Pattern ends up having a very different look and feel compared to how it is being taught today. The original Gartley Pattern was quite a simple pattern. Gartley did not discuss any Fibonacci ratios, Elliott Wave, etc. In Gartley’s bullish example, it would appear that all he is looking for is a significant rally off of a bottom, followed by a retracement of 33% to 50%.


As you can see, the pattern above is a complex five point pattern that has to conform to specific Fibonacci ratios on each of it’s four legs. The main differences between the modern Gartley Pattern above and the original Gartley Pattern are…
1. The labels in the original pattern are A,B,C. The labels for the modern pattern are X,A,B,C,D.
2. The modern Gartley omits the original A-B leg.
3. The modern Gartley emphasizes the equality of the A-B leg and the C-D leg whereas the original does not.
4. The original Gartley pattern did not include any Fibonacci ratios.
5. The completion of the original pattern was at 33%-50% whereas the modern pattern completes at the 78.6% retracement of the XA move.
Larry Pesavento was the first person to apply Fibonacci ratio’s to the Gartley pattern. Larry observed that the Gartley pattern appeared to be a more reliable pattern if it completed at a 61.8% retracement or 78.6% retracement. Based on my 10+ years of experience with the Gartley pattern, it appears that if you have to choose between the two of these ratios, 78.6% seems to work the best. With my personal trading, I will only trade the 78.6% Gartley patterns. Why? I would rather trade less often and increase the chances of my wins on the few trades that I make. If you feel a need to trade more often, it may be time to take a personal inventory. We need patience to wait for good Gartley Patterns, remember Gartley himself said, “The art in conducting an operation of this kind lies in..Having the patience to wait …”. In addition, one of the added benefits of using the 78.6% retracement is its proximity to where our protective stop is located. Remember Gartley said,” In the other two cases, only small losses have to be taken”. So if we choose the 78.6% versus the 61.8% Fibonacci level to enter, our risk will be reduced if we use the location Gartley suggested for our stop. If we are wrong, we will risk less money with an entry at 78.6% versus 61.8%.
One of the other reasons that I prefer the 78.6% level is that the public is typically unaware of this level as it does not appear in the defaults of most Fibonacci retracement drawing tools. Therefore there is contrarian value in using this level. Also, by the time a market arrives at 78.6%, most of the typical 61.8% fib traders have been stopped out. At this point in time, there is a lot of uncertainty as traders watch for a bounce or a break based on their focus on the previous high or low. Also, typically there is an increase in the volatility in the 78.6% retracement area as the market begins to reflect the uncertainty of its participants. The volatility in this zone will help us if we enter with a multiple contract strategy that allows us to leverage the scale out of the market.